




I am a principle data science analyst at Mayo Clinic. I am an AI enthusiast, passionate in finding solutions using AI. I design deep learning models for Computer Vision and Natural Language Processing tasks and deploy on Google Cloud Platform for optimal performance.
Also, I am a co-founder of easy-tensorflow website. We write simple tutorials on the basics of deep learning and how to write codes with TensorFlow library.
My interests are machine learning, deep learning, computer vision and natural language processing.










Easy-TensorFlow is an open source project which is aimed to provide simple and ready-to-use tutorials for TensorFlow.
We have held several workshops in collaboration with CACDS and UH Math.
This project has been GitHub trending repository of the month and currently has more than 2.5K followers on GitHub.
Joint work with Aryan Mobiny and Mohammad Najarian.
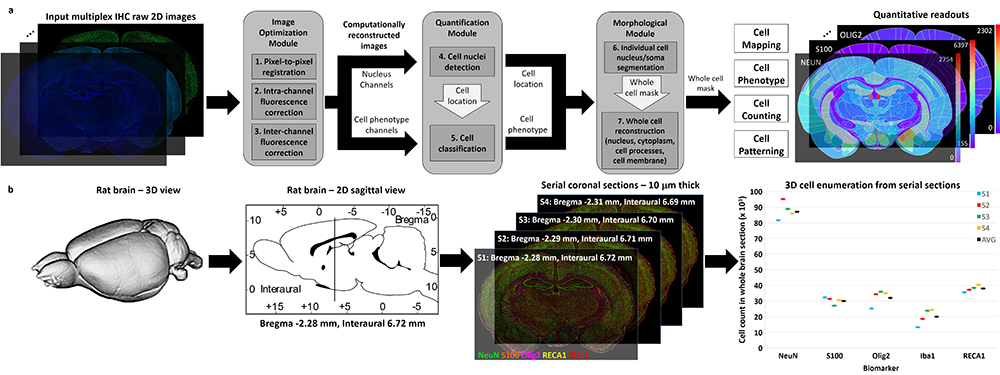
Mapping biological processes in brain tissues requires piecing together numerous histological observations of multiple tissue samples. We present a direct method that generates readouts for a comprehensive panel of biomarkers from serial whole-brain slices, characterizing all major brain cell types, at scales ranging from subcellular compartments, individual cells, local multi-cellular niches, to whole-brain regions from each slice.
This approach can accelerate pre-clinical drug evaluation and system-level brain histology studies by simultaneously profiling multiple biological processes in their native anatomical context.

Studying the cell population in niche level is a necessary task to understand the relationship between cells in a tissue.
In this study a deep clustering pipeline is implemented for biomedical data discovery. For this purpose, a scattering network is used to extract the deep translation invariant features of each cell. These deep features are used in a hierarchical clustering algorithm to find similar groups of cells. We have designed a Graphical User Interface (GUI) to visualize the clusters on top of the images to give the biologists the ability to do further analysis. This method identifies unknown cellular alterations among the cells.
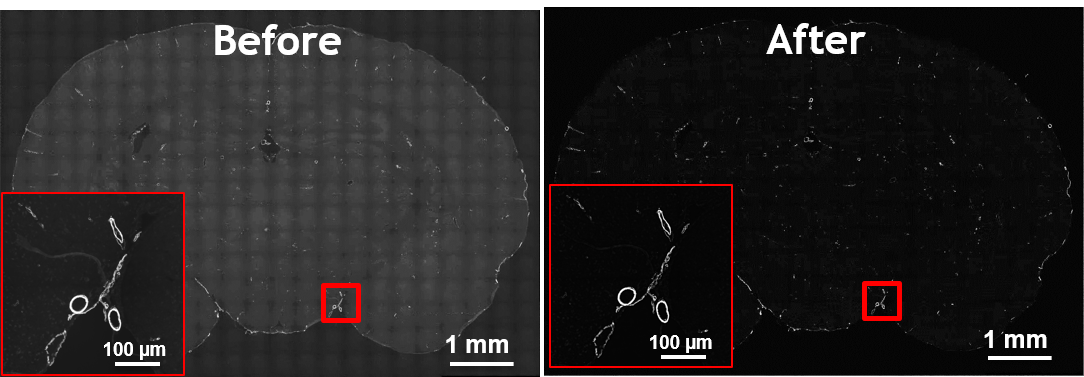
The main purpose of fuorescence microscopy is to reveal the object of interest and black background otherwise. But due to the existence of auto-fuorescence in many organic substances, the desired black background is not achieved in the image.
In this project an intra-channel signal correction algorithm is implemented to leverege morphology related features in order to estimate and extract non-specific signals such as auto-fluorescence, photo-bleaching, non-uniform illumination and tissue folds.

Increment in the number of excitation emission causes bleaching and phototoxicity resulting in weakening the fuorescent signal. Moreover, the overlap of the emission spectra results in spectral bleed-through or molecular co-localization of channels.
In this project a two step linear sparse unmixing algorithm is implemented. First, an unsupervised sparse unmixing is implemented for bleedthrough correction which inferes the non-specific channels (endmembers) and the abundance of the endmembers from the source channel. Second, user can correct the abundance matrix in a semi-supervised manner for chemical co-localization correction of signals.
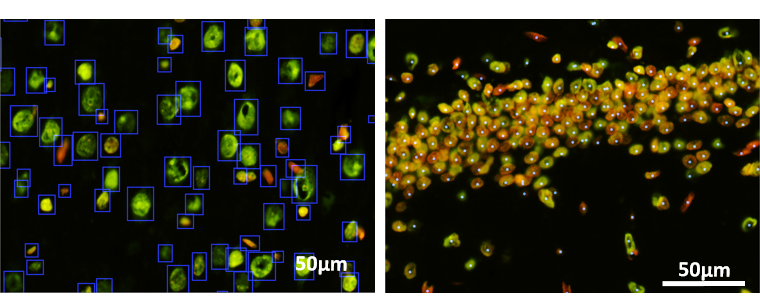
Accurate counting and detecting the cells in an image dataset is the first and the most important step in any quantitative analysis pipeline.
In this project a semi-supervised deep transfer learning method is implemented to learn the rules of existing segmentation methods and improve the performance by learning from a small set of corrected labels. By this means, we reduced the labeling effort of generate thousands of training samples for deep learning networks drastically.
Joint work with Xiaoyang Li.

Human Cell Atlas (HCA) is the first single-cell sequencing dataset now available to the research community. Profiling of immunocytes by single cell RNA-seq helps us to understand human health and disease.
In this project, a non-paramteric clustering method is designed with an interactive GUI to explore and visualize the cells in high dimension. Furthermore, the sum of expressed genes in each cluster is presented as a heatmap table to further investigate the relationship of different genes.